Federal Spending: Where Does the Money Go
Federal Budget 101
Original Article Source: https://www.nationalpriorities.org/budget-basics/federal-budget-101/spending/
In fiscal year 2015, the federal budget is $3.8 trillion. These trillions of dollars make up about 21 percent of the U.S. economy (as measured by Gross Domestic Product, or GDP). It’s also about $12,000 for every woman, man and child in the United States.
So where does all that money go?
Mandatory and Discretionary Spending
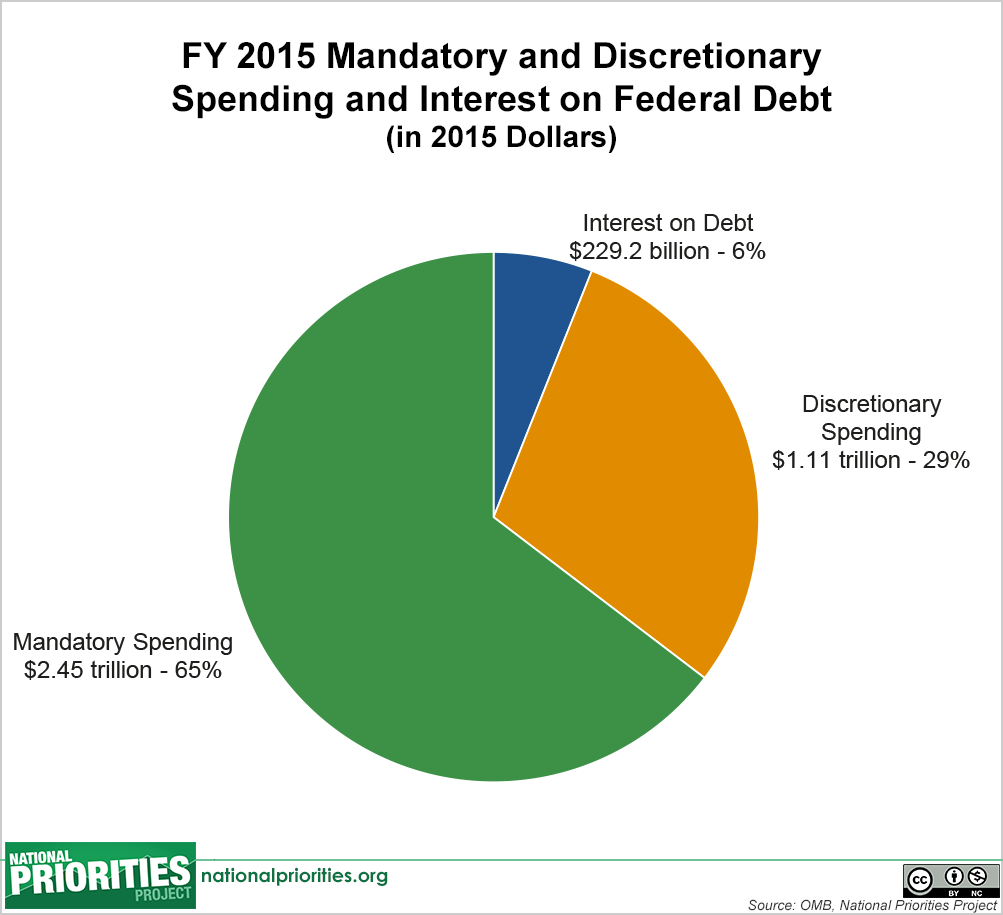
The U.S. Treasury divides all federal spending into three groups: mandatory spending, discretionary spending and interest on debt. Mandatory and discretionary spending account for more than ninety percent of all federal spending, and pay for all of the government services and programs on which we rely. Interest on debt, which is a much smaller amount than the other two categories, is the interest the government pays on its accumulated debt, minus interest income received by the government for assets it owns. The pie chart shows federal spending in 2015 broken into these three categories.
Interest on Federal DebtDiscretionary SpendingMandatory SpendingFY2015 Mandatory and Discretionary Spending and Interest onFederal Debt(In 2015 Dollars)

Discretionary Spending
Discretionary spending refers to the portion of the budget that is decided by Congress through the annual appropriations process each year. These spending levels are set each year by Congress.
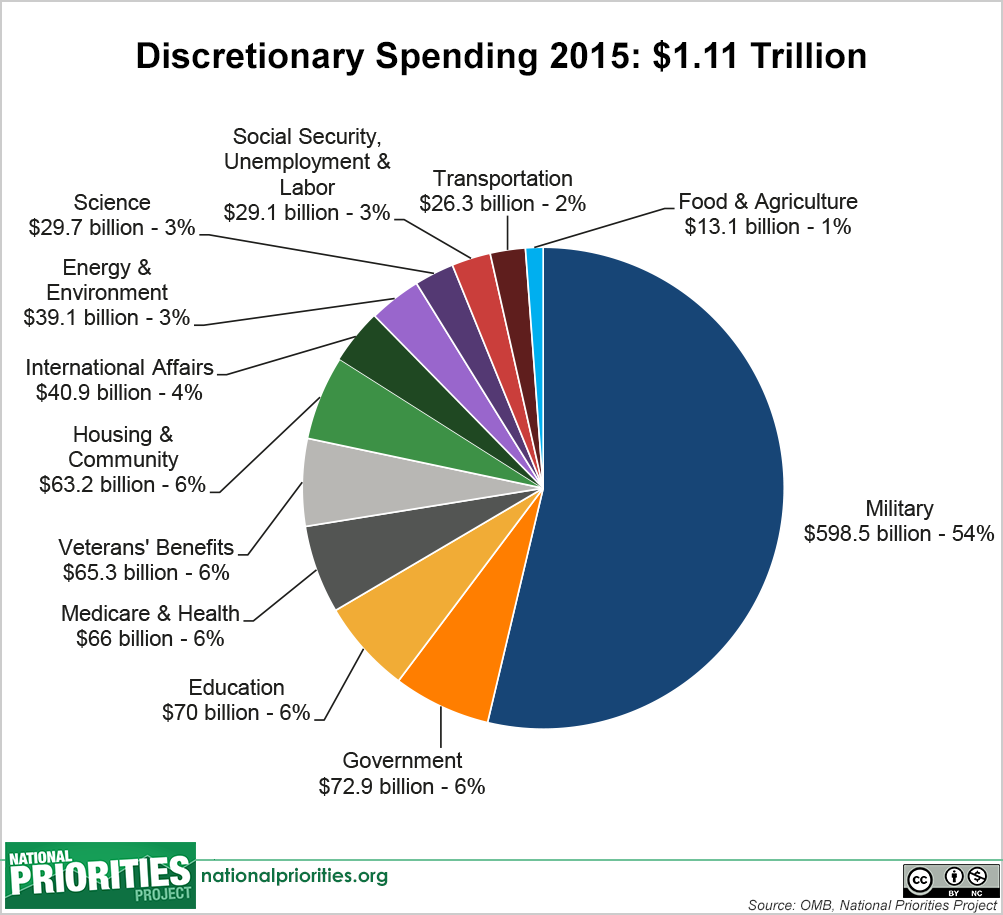
This pie chart shows how Congress allocated $1.11 trillion in discretionary spending in fiscal year 2015.
MilitaryGovernmentEducationMedicare & HealthVeterans’ BenefitsHousing & CommunityInternational AffairsEnergy & EnvironmentScienceTransportationFood & AgricultureDiscretionary Spending 2015: $1.11 Trillion

By far, the biggest category of discretionary spending is spending on the Pentagon and related military programs. Examples of other well-known programs paid for by discretionary spending include the early childhood education program Head Start (included in Housing & Community), Title I grants to disadvantaged schools and Pell grants for low-income college students (Education), food assistance for Women, Infants and Children (WIC), training and placement for unemployed people provided by Workforce Investment Boards (in Social Security, Unemployment and Labor), and scientific research through the National Institutes of Health (NIH) and National Science Foundation (NSF), among many others.
Mandatory Spending
Mandatory spending is spending that Congress legislates outside of the annual appropriations process, usually less than once a year. It is dominated by the well-known earned-benefit programs Social Security and Medicare. It also includes widely used safety net programs like the Supplemental Nutrition Assistance Program (SNAP, formerly food stamps), and a significant amount of federal spending on transportation, among other things.
Many mandatory programs’ spending levels are determined by eligibility rules. For example, Congress decides to create a program like Social Security. It then sets criteria for determining who is eligible to receive benefits from the program, and benefit levels for people who are eligible. The amount of money spent on Social Security each year is then determined by how many people are eligible and apply for benefits.
Congress therefore does not decide each year to increase or decrease the budget for Social Security or other earned benefit programs. Instead, it periodically reviews the eligibility rules and may change them in order to exclude or include more people, or offer more or less generous benefits to those who are eligible, and therefore change the amount spent on the program.
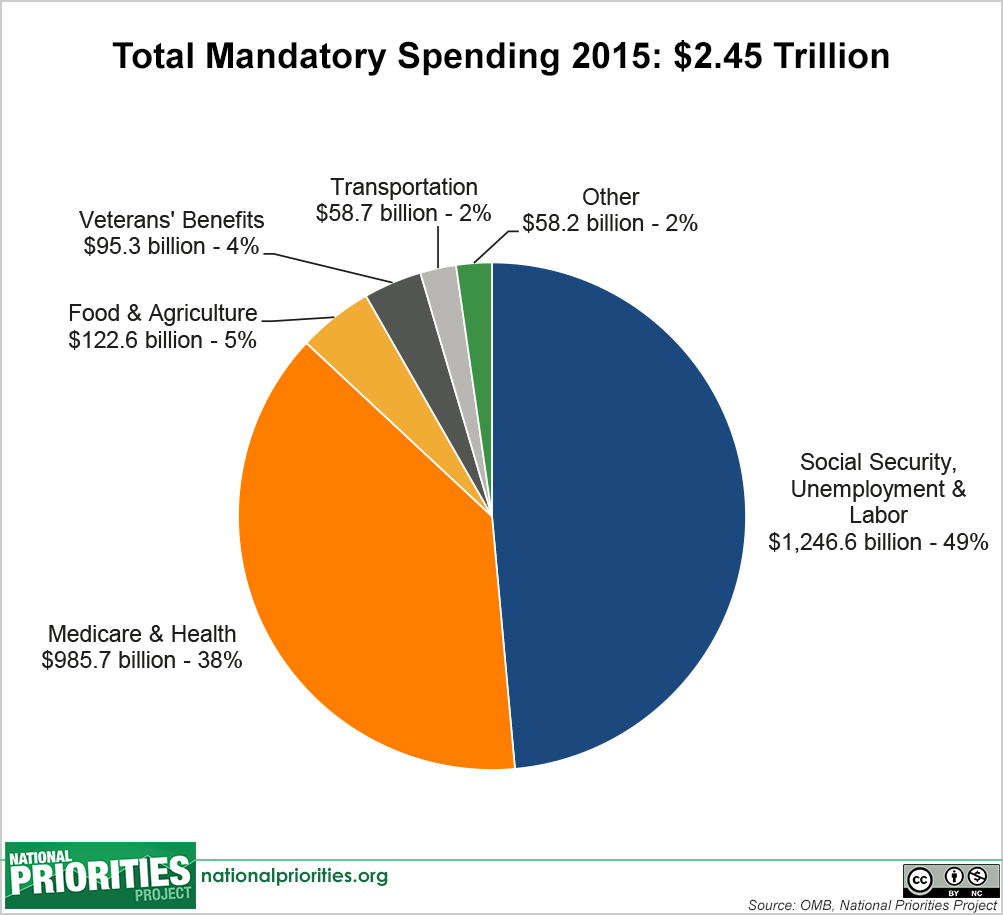
Mandatory spending makes up nearly two-thirds of the total federal budget. Social Security alone comprises more than a third of mandatory spending and around 23 percent of the total federal budget. Medicare makes up an additional 23 percent of mandatory spending and 15 percent of the total federal budget.
This chart shows where the projected $2.45 trillion in mandatory spending will go in fiscal year 2015.
Social Security, Unemployment & LaborMedicare & HealthFood & AgricultureVeterans’ BenefitsTransportationOtherTotal Mandatory Spending 2015: $2.45 Trillion

All Federal Spending
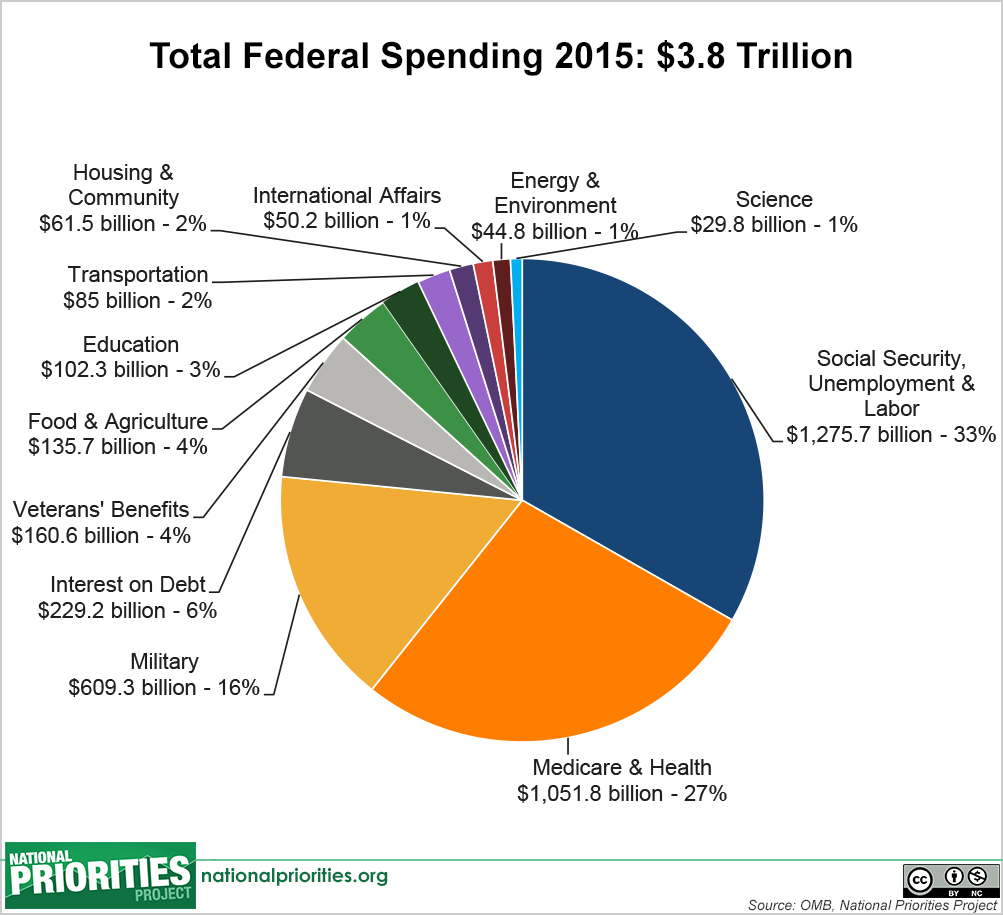
Finally, putting together discretionary spending, mandatory spending, and interest on the debt, you can see how the total federal budget is divided into different categories of spending. This pie chart shows the breakdown $3.8 trillion in combined discretionary, mandatory, and interest spending budgeted by Congress in fiscal year 2015.
Social Security, Unemployment & LaborMedicare & HealthMilitaryInterest on DebtVeteran’s BenefitsFood & AgricultureEducationTransportationHousing & CommunityInternational AffairsEnergy & EnvironmentScienceTotal Federal Spending 2015: $3.8 Trillion

Spending and Revenue
Here’s how federal spending and revenue in 2015 add up:

Spending in the Tax Code
When the federal government spends money on mandatory and discretionary programs, the U.S. Treasury writes a check to pay the program costs. But there is another type of federal spending that operates a little differently. Lawmakers have written hundreds of tax breaks into the federal tax code – for instance, special low tax rates on capital gains, and a deduction for home mortgage interest – in order to promote certain activities they deem beneficial to society.
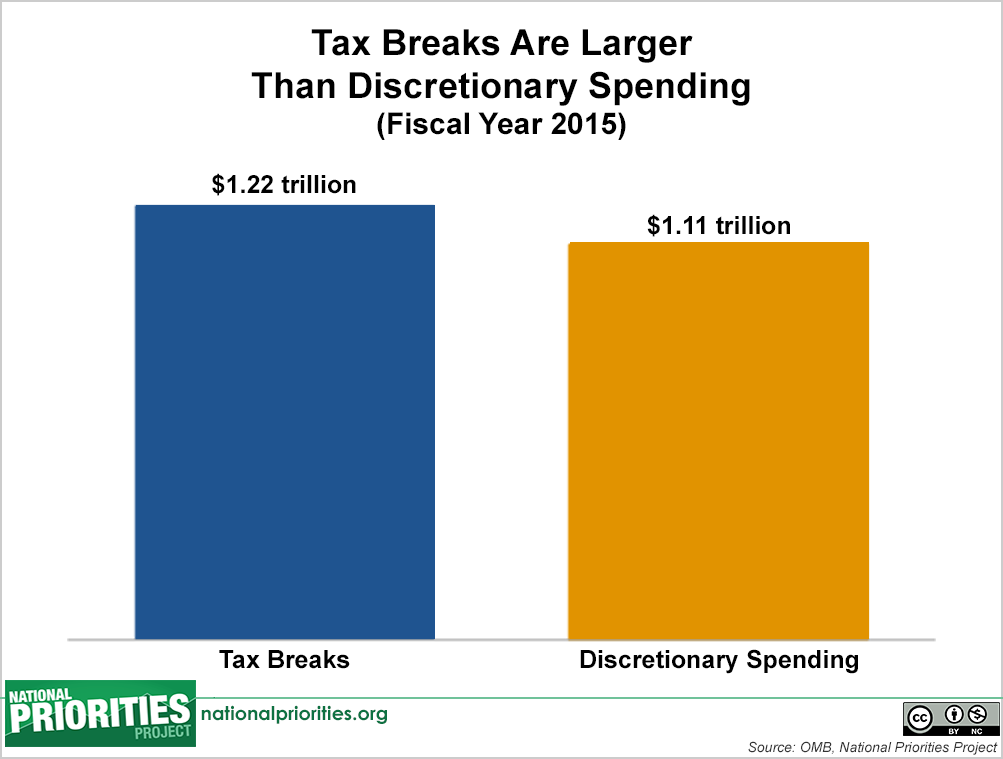
In fact, tax breaks function as a type of government spending, and they are officially called “tax expenditures” within the federal government. When the government issues a tax break, it chooses to give up tax revenue for a specific purpose – so both spending and tax breaks mean less money in the U.S. Treasury, and both reflect spending priorities laid out by Congress in various pieces of legislation. Tax breaks are expected to cost the federal government $1.22 trillion in 2015 – more than all discretionary spending in the same year.
Tax Breaks are Larger Than Discretionary Spending(Fiscal Year 2015)Tax BreaksDiscretionary Spending

Unlike discretionary spending, which must be approved by lawmakers each year during the appropriations process, tax breaks do not require annual approval. Once written into the tax code, they remain on the books until lawmakers modify them. That means that even when tax breaks fall short of, or outlive their original purpose intended by Congress, they frequently stay on the books.
Your gift helps NPP build a better budget for our nation! Make your gift now to support our work.